The business question sounds simple: how is football talent distributed across leagues, clubs, and positions? The hard part is that the only available data is FIFA's own rating system — a game-derived proxy that reflects EA Sports' internal modeling decisions, not real-world player performance or market value. That constraint shapes everything. It determines which questions the data can answer, which it can't, and how carefully findings have to be framed before they're useful to anyone.
This project analyzes 3.48 million male player-snapshot records and a 668-player female attributed subset from FIFA 23, using a SQL-first pipeline with pre-committed cross-validation thresholds on every finding. Two structural claims are confirmed. Four recommendations follow from them. Four more were explicitly refused because the evidence doesn't support them — including the most tempting one, which would have turned a descriptive rating pattern into a real-world scouting recommendation.
The result is two confirmed structural findings, four refused recommendations, and a pipeline that makes every number traceable to its source. The analysis is bounded to what the rating system can describe — and disciplined about where that boundary sits.
Each claim below was confirmed against a primary query and at least one independent cross-validation before being included. High confidence means the finding holds across multiple snapshot scopes and query strategies. The two findings here are the only ones the evidence supports — anything beyond them is documented in the refused recommendations.
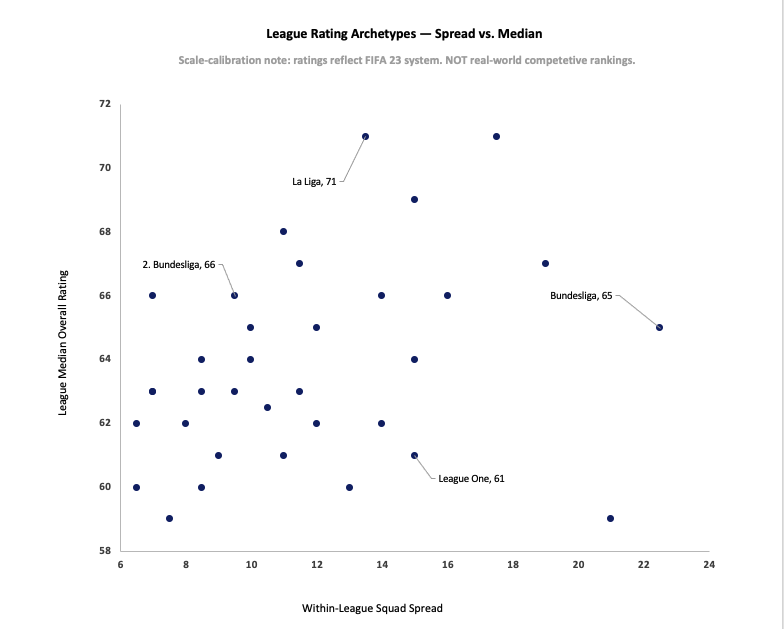
League talent distribution in FIFA 23 isn't one-dimensional. Median overall rating and within-league club spread vary independently — and those two axes together reveal two distinct structural patterns. Depth-based leagues like La Liga sit in the upper-left: high median talent, low spread between top and bottom clubs. Elite-concentration leagues like Bundesliga sit in the lower-right: moderate aggregate talent, but a 22.5-point gap separating the strongest clubs from the weakest. Bundesliga ranks 12th by median but 1st by within-league spread. La Liga ranks 2nd by median but 11th by spread. The archetype distinction isn't subjective — it's what you get when you stop treating talent concentration as a single axis.
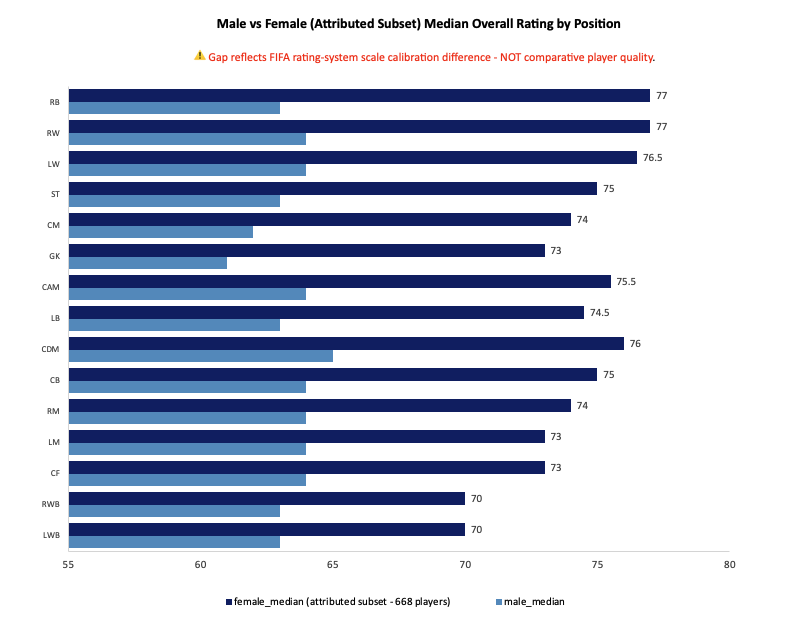
Female player ratings exceed male ratings at all 15 positions without exception, with gaps ranging from 7 to 14 points. That gap doesn't reverse at any position, can't be explained by male positional variation (which spans only 4 points total), and is structurally consistent across both the reference snapshot and the full female dataset. What it reflects is a scale calibration difference between FIFA's male and female rating systems — two populations benchmarked against different internal reference points, producing numbers that look comparable but aren't. This is not a finding about comparative player quality. It's a finding about how FIFA's rating system is built.
Four recommendations follow directly from the two confirmed claims. Each is scoped to stakeholders who work within the FIFA rating system domain — not to real-world football operations, which the data cannot support.
FIFA ratings teams should audit the five highest-spread leagues to verify that within-league club rating gaps reflect actual competitive structure rather than rating artifacts. Bundesliga's 22.5-point spread is 68% larger than La Liga's 13.5 despite both being Tier-1 European leagues. If that gap doesn't align with real-world observable disparities, it signals that FIFA's club-level allocation logic is overcalibrating separation in some leagues relative to others.
Ultimate Team economists building cross-gender card pricing models should apply an explicit calibration offset — approximately 10 points at the median — rather than treating male and female ratings as points on a single scale. The 7–14 point gap is structurally consistent and not explained by positional composition. Ignoring it means pricing models built on raw ratings are comparing populations that weren't designed to be compared directly.
Esports analysts and content creators producing tier lists or league rankings should segment by archetype before ranking. A league with a moderate median and extreme spread isn't worse than one with a high median and low spread — it's a different structural type. Ranking them on a single axis produces a misleading output. The two-dimensional framework here gives a more honest picture.
Researchers studying game-based talent models should document the cross-population calibration gap as a reference case. A 7–14 point systematic offset that is consistent across 15 positions, doesn't reverse, and isn't explained by compositional differences is a clean structural finding. It's a useful baseline for anyone investigating how sports simulation systems handle cross-gender modeling.
Four recommendations were considered and explicitly declined. Each represents a plausible extension of the confirmed findings — the kind of leap a stakeholder might reasonably request. All four were refused because the data structurally cannot support them. The refusals are documented with the same specificity as the recommendations because knowing where the evidence ends is as important as knowing what it shows.
Based on the archetype finding, a scouting department might ask whether to prioritize depth-based leagues for talent pipelines or elite-concentration leagues for top-tier acquisitions. That recommendation cannot be made. The archetype distinction describes how FIFA allocates ratings across clubs — not which allocation pattern correlates with real-world player development quality, transfer success rates, or match performance. A low-spread league in FIFA might reflect genuine competitive parity, editorial compression, or policy-driven parity — there's no way to tell from this data. What would be required: player-level scouting outcome data showing that FIFA archetype classification predicts real-world talent yield.
A team analyst might ask whether to build squads differently based on their league's archetype — star-heavy in elite-concentration leagues, balanced in depth-based ones. That recommendation cannot be made. Nothing in this analysis connects archetype classification to optimal squad construction strategy, win rates, or competitive outcomes. The dataset contains no match results, no financial data, and no performance covariates. Archetype is a descriptive label about rating distribution — it doesn't determine how to build a squad.
It would be natural to ask whether the two-archetype framework applies to the female population as well. It doesn't — not because the framework is wrong, but because 97.31% of female interim rows lack league attribution. The 668-player attributed subset cannot support the kind of league- and club-level aggregation that produced the male archetype finding. Extending the framework to the female population would describe a 2.69% slice and present it as a population-level finding. That's not an extension. It's a misrepresentation.
The 7–14 point cross-population gap is a consistent, structural finding. It would be tempting to interpret it as evidence that FIFA's rating system is biased — systematically inflating female ratings or deflating male ones. That interpretation cannot be made from this data alone. Without access to EA Sports' intended calibration methodology, we cannot distinguish between an offset that was designed intentionally, one that emerged as a side effect of separate benchmarking processes, and one that represents a genuine methodological error. The finding establishes that a gap exists. It cannot establish what caused it or whether it was intended.
FIFA's rating system has structure — but not the structure most people assume. League talent isn't a single ranking. The two-dimensional archetype framework here is more honest than any tier list. And the cross-population gap isn't about player quality — it's about how two separate rating systems relate to each other. Both findings only make sense if you hold the boundary between what the data describes and what it can't explain.
Two visuals approved and built — each declared in the EDA Findings block before construction began. Two candidate visuals were formally declined: the Q1 baseline distribution histogram (the archetype finding communicates the structural claim more directly) and a standalone within-league spread ranking (the scatter already shows spread as an independent axis; a ranked bar adds a different view of the same data without adding a new finding).